> For the complete documentation index, see [llms.txt](https://docs.globo.io/llms.txt). Markdown versions of documentation pages are available by appending `.md` to page URLs; this page is available as [Markdown](https://docs.globo.io/globo-mega-menu/analytics-and-billing/analytics.md).
# Analytics
See how shoppers use your menu — clicks, impressions, orders and revenue.
The **Analytics** page shows how shoppers use your menus: how often menus are seen and clicked, which links get the most clicks, and which orders and revenue came after a menu click. Use it to find links nobody uses, spot your best-performing menu items, and measure the effect of a campaign menu.
{% hint style="info" %}
**Clicks** are tracked on every plan. **Impressions**, **Orders** and **Revenue** are collected on **Growth Navigation** and **Pro Navigation**. On **Basic Navigation** (free), the page shows a banner with a **View pricing** button. See [Plans and Billing](/globo-mega-menu/analytics-and-billing/plans-and-billing.md).
{% endhint %}
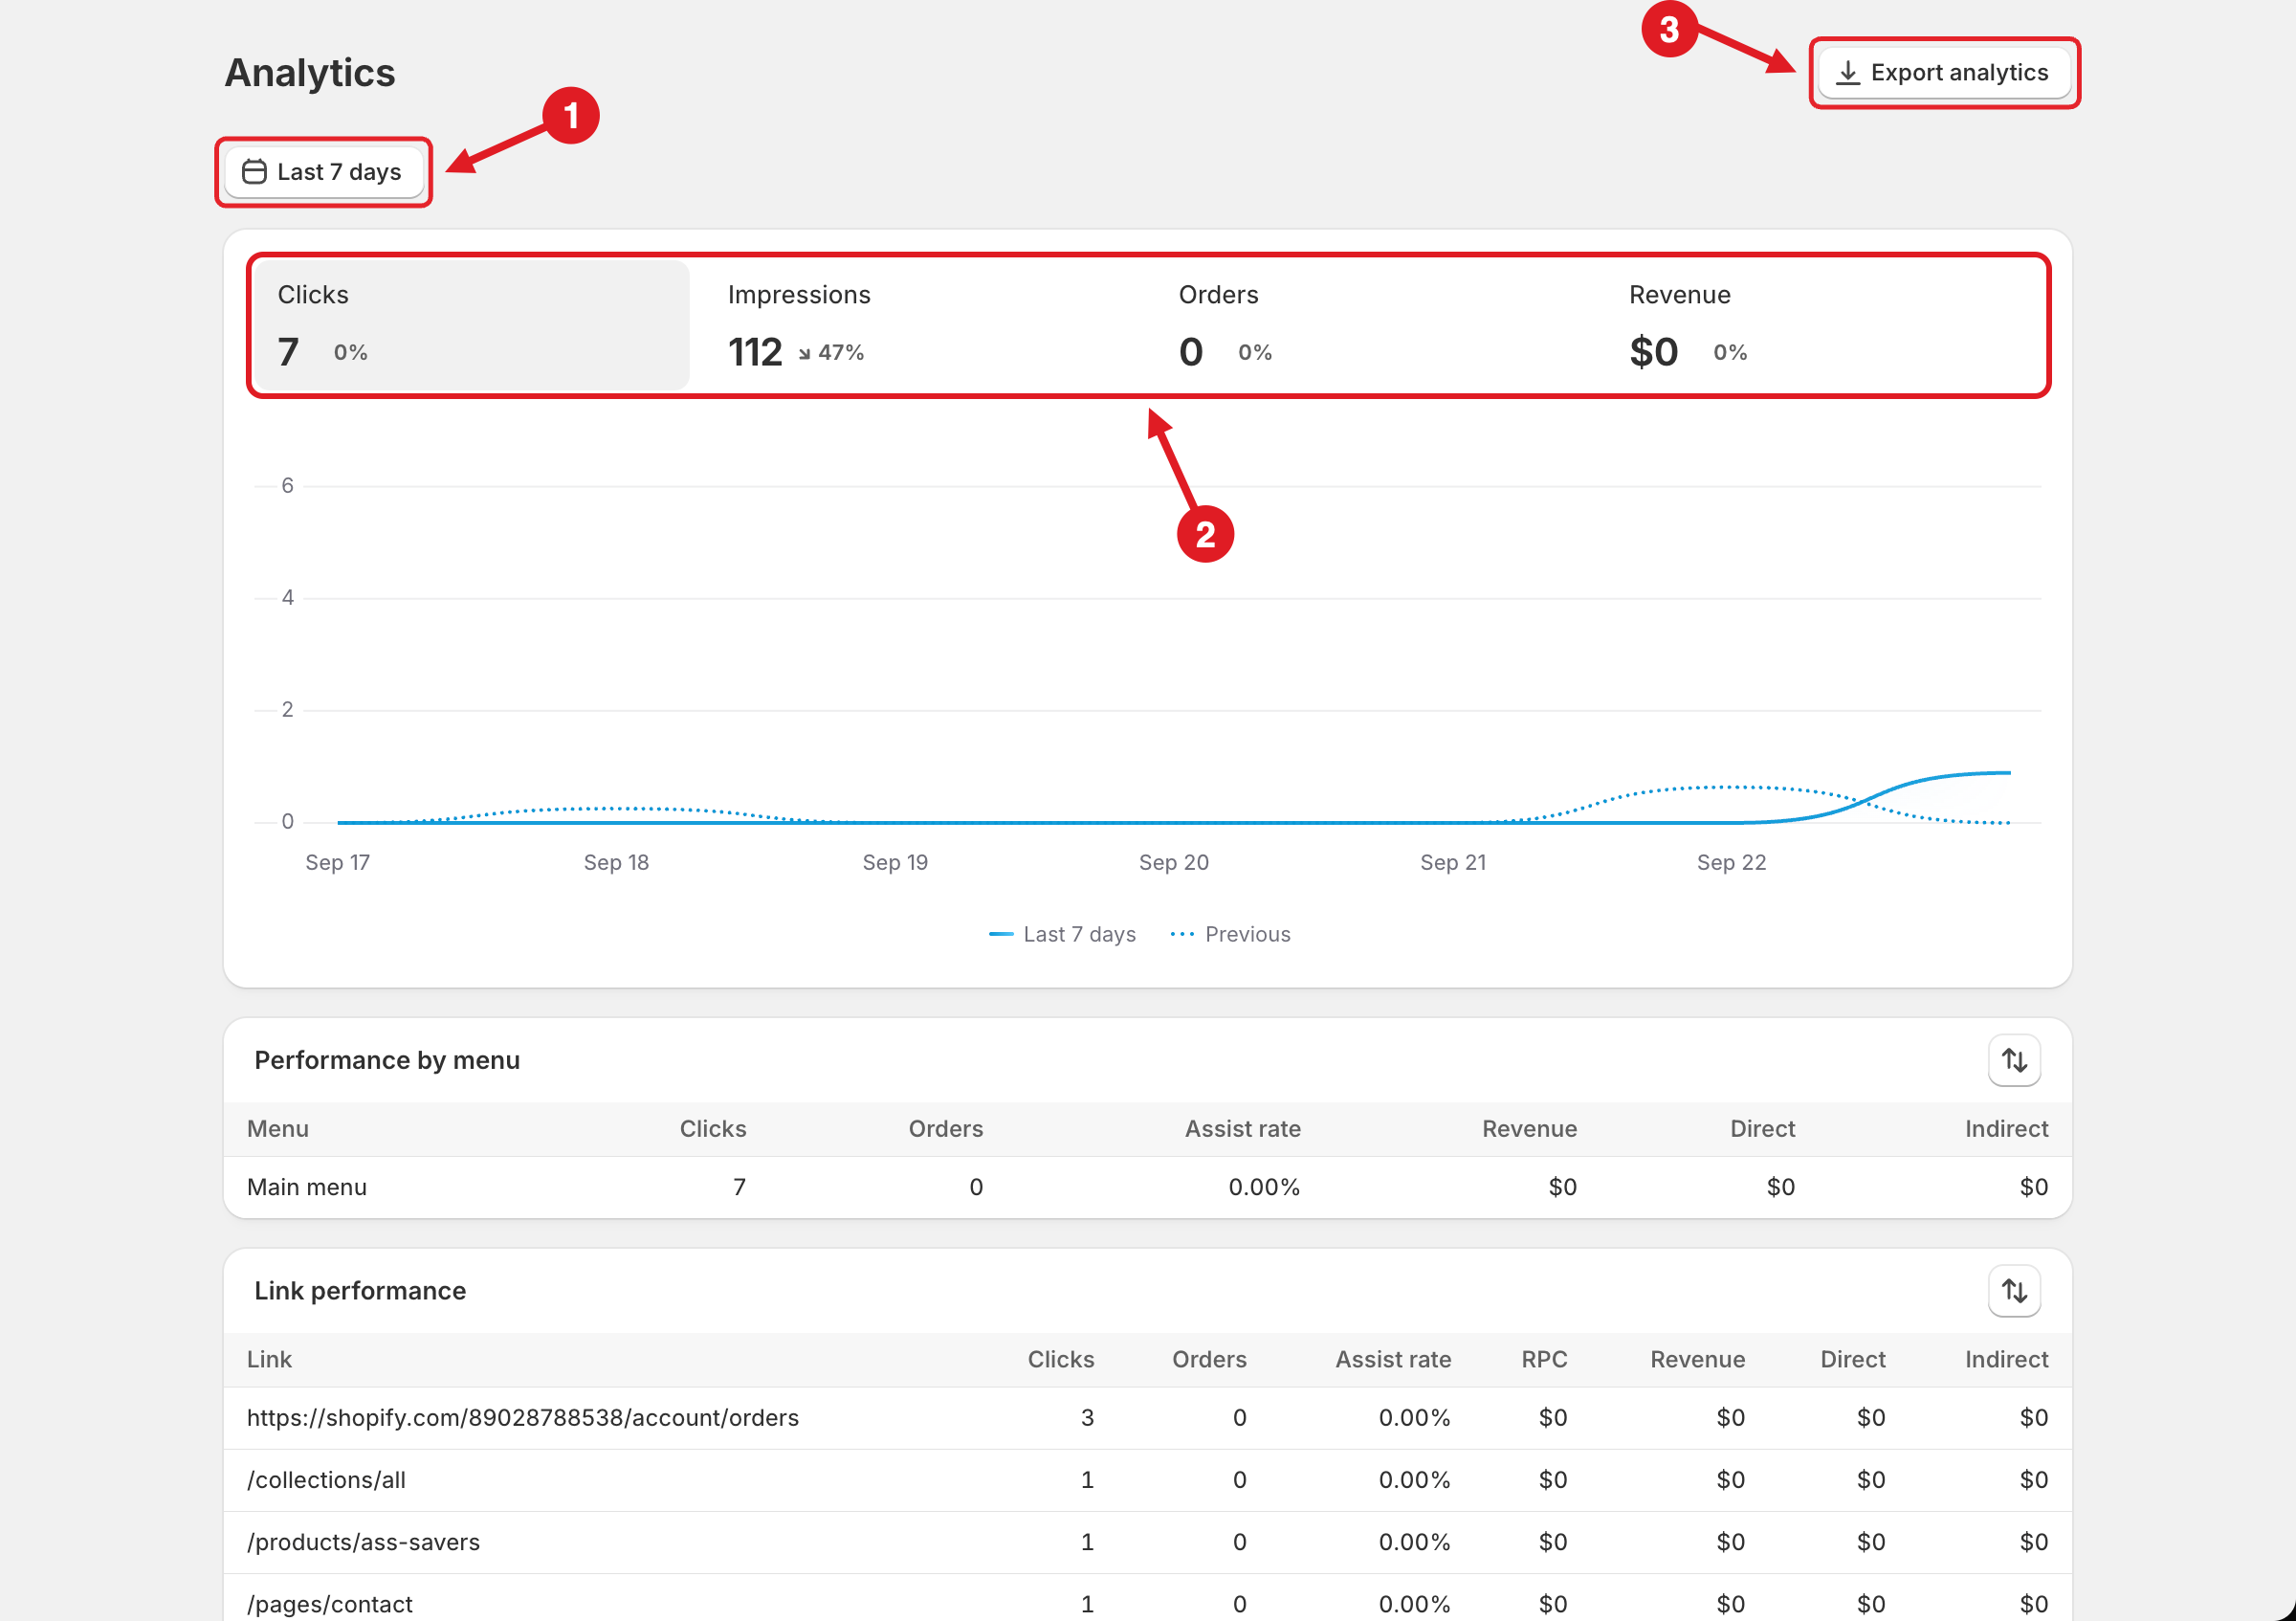
Choose a date range (1), read the overview (2) and export the data (3)
## Read Your Analytics
{% stepper %}
{% step %}
### Open Analytics
Click **Analytics** in the app sidebar.
{% endstep %}
{% step %}
### Choose a date range
Click the date button (1), for example **Last 7 days**, and choose **Today**, **This week**, **Last week**, **This month**, **Last 7 days**, **Last 30 days**, **Last 60 days** or **Custom range** (pick a **Start date** and **End date**, then click **Apply**).
{% endstep %}
{% step %}
### Read the overview
The four tiles (2) show the totals for the selected period, with the % change compared to the previous period of the same length. Click a tile to show that metric in the chart. The solid line is the selected period; the dotted **Previous** line is the period before it.
{% endstep %}
{% step %}
### Dig into the tables
Scroll down to **Performance by menu**, **Link performance** and **Impression by landing page**. Use the sort button (⇅) on each table to sort it.
{% endstep %}
{% step %}
### Export the data (optional)
Click **Export analytics** (3), choose the **Analytics section** to export, then click **Export**. A CSV file downloads for the selected date range.
{% endstep %}
{% endstepper %}
## 📊 What Each Metric Means
**Overview tiles**
| Metric | Meaning |
| --------------- | -------------------------------------------------------------------------- |
| **Clicks** | Total clicks on links in all your menus |
| **Impressions** | Total times your menus were shown, across all pages |
| **Orders** | Orders placed by shoppers after they clicked a menu link (assisted orders) |
| **Revenue** | Revenue from those assisted orders, in your store currency |
**Tables**
| Table | Columns |
| ------------------------------ | ----------------------------------------------------------------------------------------------------------------- |
| **Performance by menu** | Each menu with its **Clicks**, **Orders**, **Assist rate**, **Revenue**, **Direct** and **Indirect** revenue |
| **Link performance** | Each clicked link with **Clicks**, **Orders**, **Assist rate**, **RPC**, **Revenue**, **Direct** and **Indirect** |
| **Impression by landing page** | Each page (**Path**) where a menu was shown, the **Menu**, and its **Impressions** |
What the columns mean:
* **Assist rate** — orders ÷ clicks, as a percentage. For example, 2 orders from 100 clicks = 2.00%.
* **RPC** (revenue per click) — revenue ÷ clicks for that link.
* **Direct** — revenue from products the shopper clicked (or added to cart) from the menu and then bought.
* **Indirect** — the rest of the order's revenue: other products in orders placed after a menu click. **Direct** + **Indirect** = **Revenue**.
{% hint style="warning" %}
**Orders** and **Revenue** are **assisted** figures — orders placed after a menu click — and are meant as a reference, not an exact accounting figure. For your real sales numbers, use Shopify **Analytics**.
{% endhint %}
## 📥 Export Sections
| Analytics section | CSV columns |
| ------------------------------ | -------------------------------------------------------------------- |
| **Performance by menu** | Menu, Clicks, Orders, Revenue, Direct revenue, Indirect revenue |
| **Link performance** | Link, Clicks, Orders, Revenue, Direct revenue, Indirect revenue, RPC |
| **Impression by landing page** | Path, Menu, Impressions |
{% hint style="info" %}
**No data yet?** Data appears only after shoppers view and click your published menu. On a new menu, check again after a day or two, and make sure the date range covers the days since you published.
{% endhint %}
***
### Related Articles
{% content-ref url="/pages/RZ0tOkDBtsU0FqS1hbYJ" %}
[Plans and Billing](/globo-mega-menu/analytics-and-billing/plans-and-billing.md)
{% endcontent-ref %}
{% content-ref url="/pages/ae5iAailCwvlkNqFtWrN" %}
[Multiple Menus and Campaigns](/globo-mega-menu/manage-menus/multiple-menus-and-campaigns.md)
{% endcontent-ref %}
***
**💬 Need help?**
Email us at **📧** [**contact@globo.io**](mailto:contact@globo.io) - we’re happy to assist!